Discover the Adani Power share price in 2023! Explore financial analysis, price points, and technical overview.
Adani Power is one of the largest power generation companies in India. The company has a diversified portfolio of power assets, including coal-fired, gas-fired, and renewable power plants. Adani Power’s shares are listed on the Bombay Stock Exchange (BSE) and the National Stock Exchange (NSE).
In this blog post, we will take a detailed look at Adani Power share, including its price points, volume, financial strength, and technical analysis.
Price Points
As of July 14, 2023, Adani Power share is trading at ₹250.60 per share on the BSE. The 52-week high for the share is ₹432.80, while the 52-week low is ₹132.55.
The share has been on a downward trend since its peak in August 2022. This is due to a number of factors, including the allegations of accounting fraud and stock manipulation made by a US short seller.
However, the share has rebounded in recent weeks, and it is possible that it could continue to rise in the future. This is due to the company’s strong financial performance and its plans to expand into new businesses.
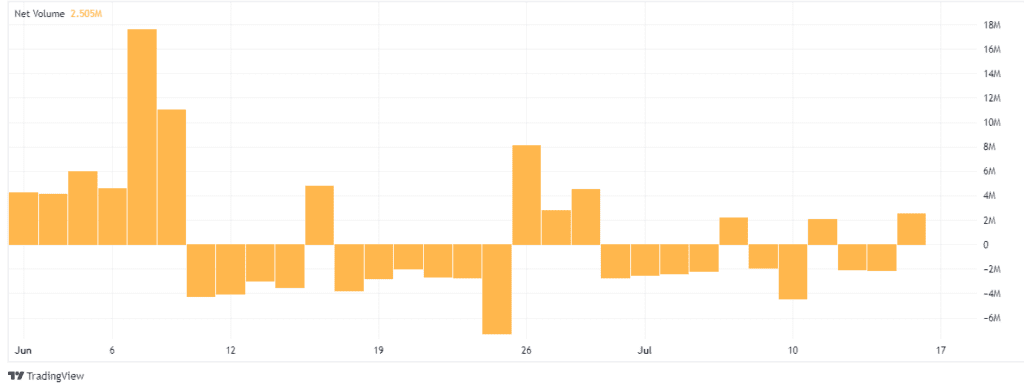
Volume
The average daily volume for Adani Power share is around 4 million shares. The highest daily volume was recorded on March 29, 2022, when 242 million shares were traded.
The high volume of trading in Adani Power share indicates that the stock is popular with investors. This is likely due to the company’s strong financial performance and its plans to expand into new businesses.
Financial Analysis
Financial analysis is the process of evaluating a company’s financial statements to assess its financial health and performance. It is an important tool for investors, creditors, and other stakeholders who need to make informed decisions about the company.
There are a number of different financial parameters that can be used in financial analysis. These include:
- Liquidity: This refers to a company’s ability to meet its short-term obligations. Liquidity ratios, such as the current ratio and the quick ratio, measure a company’s liquidity.
- Solvency: This refers to a company’s ability to meet its long-term obligations. Solvency ratios, such as the debt-to-equity ratio and the debt-to-assets ratio, measure a company’s solvency.
- Profitability: This refers to a company’s ability to generate profits. Profitability ratios, such as the return on equity (ROE) and the return on assets (ROA), measure a company’s profitability.
The specific financial parameters that are used in the financial analysis will vary depending on the purpose of the analysis. For example, an investor who is considering investing in a company will likely focus on profitability and liquidity ratios, while a creditor who is considering lending money to a company will likely focus on solvency ratios.
Financial analysis is a complex process, but it is an essential tool for anyone who needs to make informed decisions about a company’s financial health and performance.
Here are some additional financial parameters that can be used in financial analysis:
- Cash flow: This is the amount of cash that a company generates from its operations. Cash flow is important because it provides a measure of a company’s ability to generate cash to meet its obligations and invest in its future.
- Dividend yield: This is the amount of dividends that a company pays out to its shareholders as a percentage of the share price. The dividend yield is important because it provides a measure of the return that shareholders can expect to receive from their investment.
- Earnings per share (EPS): This is the amount of profit that a company generates per share of its stock. EPS is important because it provides a measure of a company’s profitability.
- Price-to-earnings ratio (P/E ratio): This is the price of a company’s stock divided by its earnings per share. The P/E ratio is important because it provides a measure of how expensive a company’s stock is relative to its earnings.
Financial analysis is a powerful tool that can be used to assess a company’s financial health and performance. By understanding the different financial parameters that can be used in financial analysis, investors, creditors, and other stakeholders can make informed decisions about the company.
Let’s perform the financial analysis of Adani power share:
1. Financial Strength of Adani power share
– Net debt-to-equity ratio: 2.21
Adani Power has a net debt-to-equity ratio of 2.21, indicating a higher level of debt compared to equity.
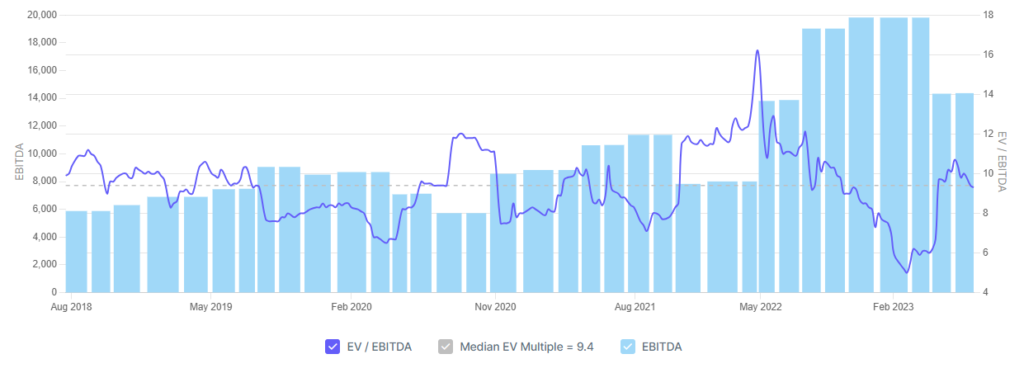
– Price to Earning Ratio: 8.7
Adani Power’s price-to-earning (P/E) ratio is 8.7, which is lower than the sector’s P/E ratio of 16.07.
– Price to Book Value: 3.12
The price-to-book value ratio for Adani Power is 3.12, indicating the market value is 3.12 times the book value of the company
– Return on Equity (ROE):
Adani Power achieved a return on equity of 44.16% in March 2023, indicating efficient utilization of shareholder’s capital to generate profits. In the previous financial year, Adani Power’s return on equity was 30.87%.
-Earnings per share (EPS):
EPS for Adani power share is Rs. 27.81 which is good.
2. Net Profit
– Annual net profit growth: 118.4%
In the last year, Adani Power’s annual net profit increased by 118.4% to Rs 10,726.6 Crores.
– Sector’s average net profit growth: 5.5%
The sector in which Adani Power operates experienced an average net profit growth of 5.5% during the last fiscal year.
– Quarterly net profit growth YoY: 12.9%
Adani Power’s quarterly net profit rose by 12.9% year-on-year to Rs 5,242.5 Crores.
– Sector’s average net profit growth YoY: -16.7%
The sector’s average net profit growth year-on-year for the quarter was -16.7%.
3. Cash Flow and Debt
– Decreased cash flow: -433 (Rs. Cr.)
Adani Power’s cash flow has decreased to -433 (Rs. Cr.) compared to the previous financial year (March 2022).
– Adani Power’s debt-to-equity ratio is 2.12, reflecting a higher proportion of debt in the company’s capital structure.
Please note that these figures provide insights into Adani Power’s financial performance and position. However, further analysis and consideration of other factors are essential before making any investment decisions.
Technical Analysis of Adani Power share
The technical analysis of Adani Power share indicates that the stock is currently in a bearish trend. The share price is near its 200 EMA.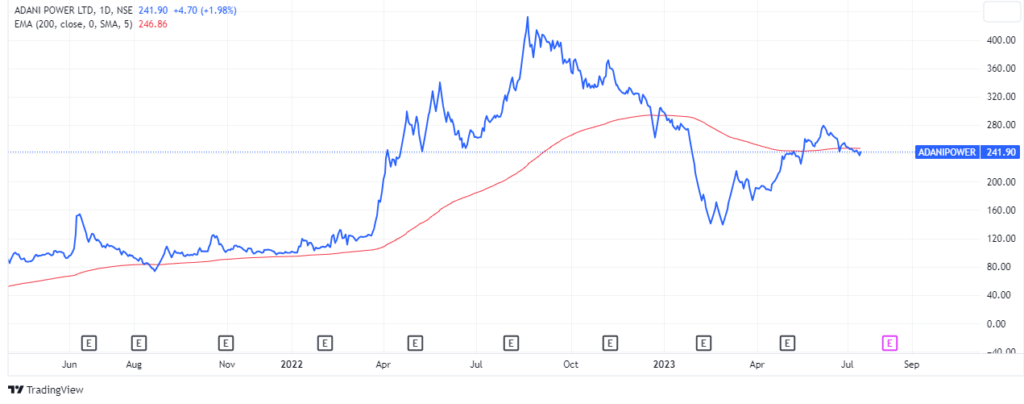
Adani power. Source: TradingView
The next weekly resistance level for the Adani power share is ₹250. If the share breaks this level, it could rise to ₹276 which is its monthly Fibonacci resistance level.
However, if the Adani power share fails to break this level, it could fall back to around ₹235.
Disclaimer
This blog post is for informational purposes only and should not be considered as investment advice. The author is not a financial advisor and does not have any formal training in finance.
The reader should do their own research before making any investment decisions.
Additional Information
In addition to the information provided in this blog post, here are some additional factors that investors should consider before investing in Adani Power share:
- The company’s exposure to the coal sector. The coal sector is facing increasing regulatory challenges, which could impact Adani Power’s profitability.
- The company plans to expand into new businesses. Adani Power is planning to expand into new businesses, such as renewable energy and solar power. These expansions could be successful, but they also carry risks.
- The company’s financial performance. Adani Power’s financial performance has been volatile in recent years. The company’s profitability could be affected by a number of factors, including changes in the regulatory environment and the price of coal.
To read about other share analyses visit Johnny Scribe